
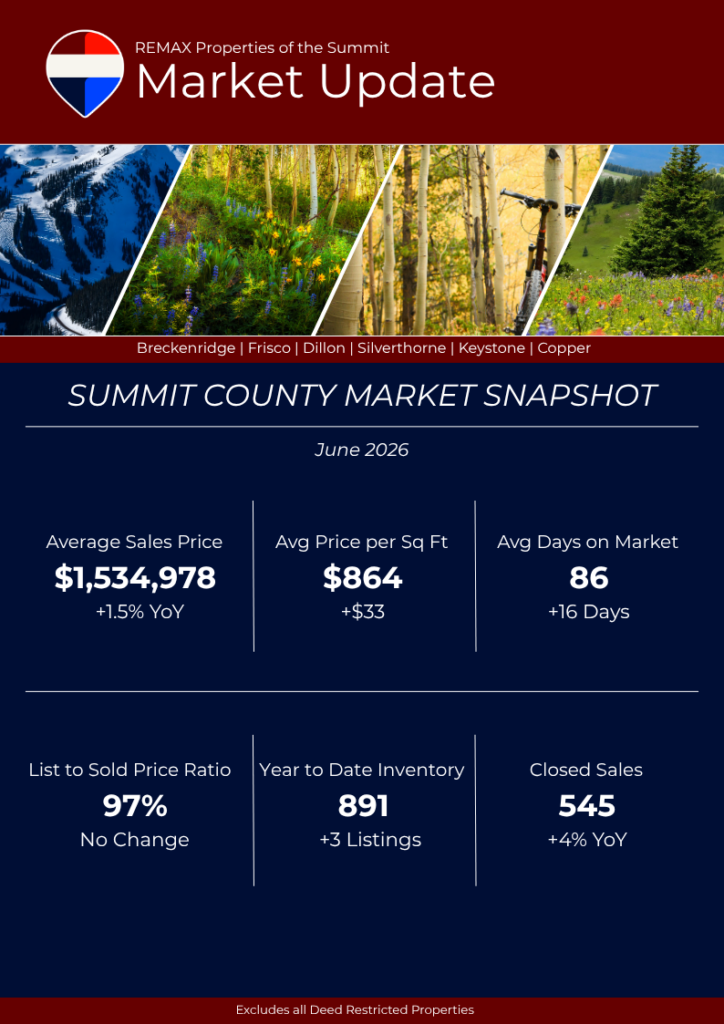
The Summit County real estate market continued to show steady momentum in June, with buyer activity picking up as the summer season got underway. Closed sales for the month significantly outpaced June 2025, contributing to a 4% increase in year-to-date sales volume across the county.
Despite stronger sales activity, prices have remained relatively stable. The average sales price through June sits at $1,534,978, up just 1.5% year over year, while the average price per square foot increased to $864, reflecting continued demand for well-located mountain properties.
Inventory levels have also improved, giving buyers more options than we’ve seen in recent years. Summit County currently has 891 active listings, and homes are averaging 86 days on market, about two weeks longer than last year. Sellers are still achieving strong results, with properties closing at an average of 97% of list price.
Much of this year’s growth has been driven by condominium sales and new construction inventory entering the market, particularly in resort communities throughout the county. While single-family home activity has softened slightly compared to last year, buyers continue to find opportunities across a wider range of price points and property types.
With summer traditionally representing the busiest season for Summit County real estate, market activity is expected to remain strong through the coming months as visitors become buyers and homeowners position themselves ahead of the ski season.
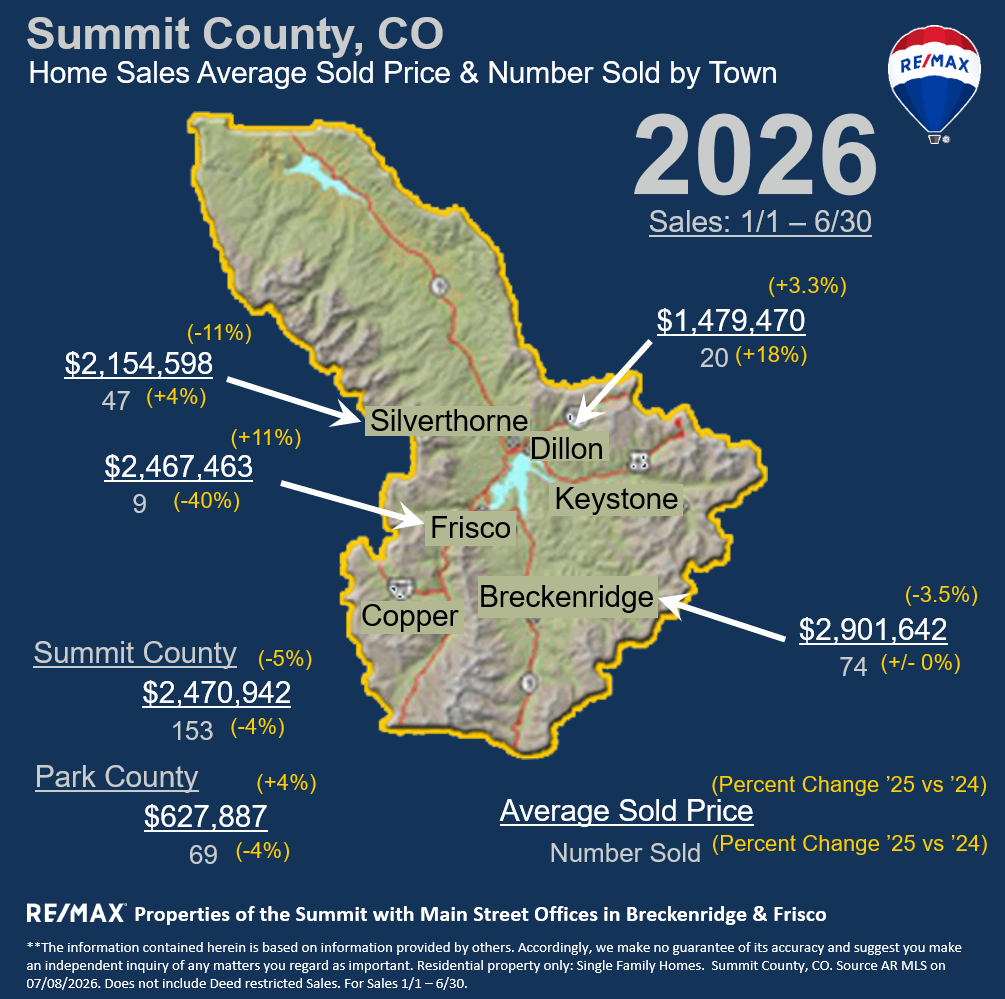
Home Sales Through Mid-Year
The chart above highlights home sales activity through the first half of 2026 and paints an interesting picture of the Summit County market. While headline numbers suggest steady growth, the details tell a more nuanced story.
Early July Activity
July has started with strong inventory growth, with nearly 100 new listings hitting the market during the first week of the month alone. Buyer activity remains active as well, with 24 properties already going under contract. Showing activity is tracking close to last year’s pace, although it is down slightly compared to this time in 2025.
Year-to-Date Market Trends
Through the first six months of 2026, overall sales volume is up 4% compared to last year. However, much of that increase is being driven by new construction activity. Without new construction sales, the market would be showing a significant year-over-year decline.
Single-family home sales continue to reflect the softer resale market conditions illustrated in the chart above. Meanwhile, condominium sales and prices have surged, largely due to the number of newly built units closing this year. When new construction condominium sales are removed from both this year’s and last year’s figures, the resale condo market tells a different story: sales are down 18% year over year, and prices have declined as well.
This split between new construction and resale activity continues to be one of the defining trends shaping the Summit County market in 2026.
Statistics By Town
Click on the links below to see statistics for each of our towns within Summit County.
Source: Sold Data from SAR MLS. Stats pulled on 7/7/26. *SAR MLS Data Year to Date Sales 1/1/26-6/30/26. *Residential Sales. Change is Year over Year 2026 vs 2025.
**The information contained herein is based on information provided by others. Accordingly, we make no guarantee of its accuracy and suggest you make an independent inquiry of any matters you regard as important.
Posted by Jan Leopold July 8, 2026