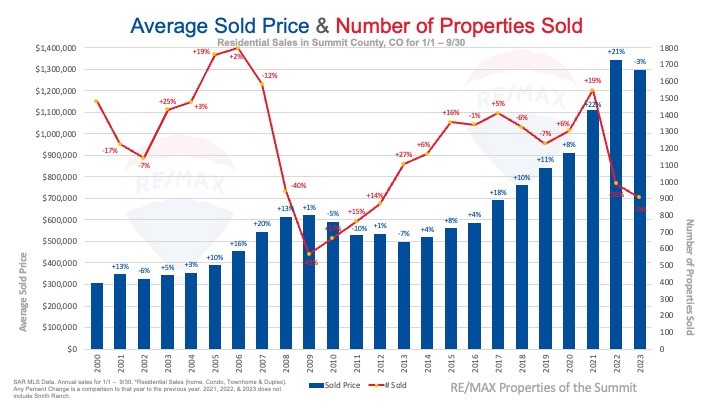
Residential Sales The chart above represents year-to-date sales through September going back to 2000. The chart shows the average residential sold price and the total number of sales for each year. Plus, the percentage changes from year to year.
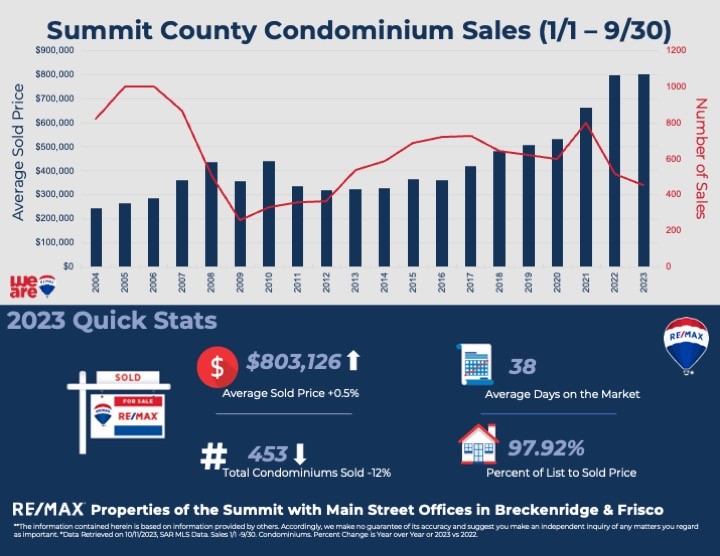
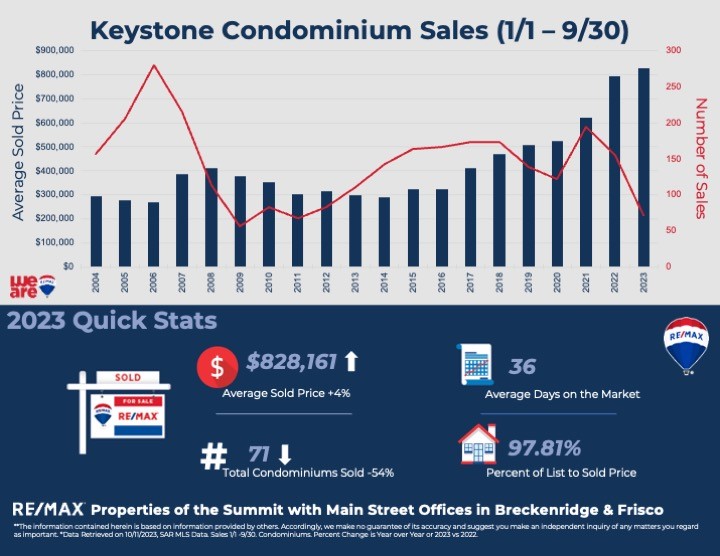
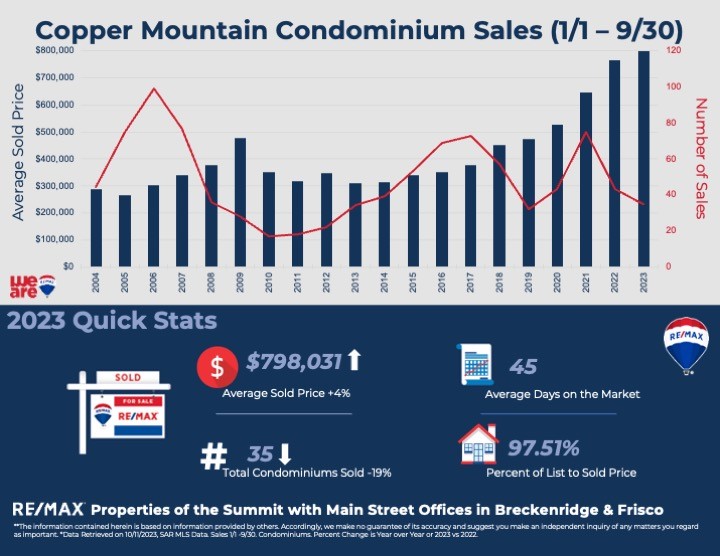
Condominium Sales:Below are detailed sales charts for Condominium sales for the county and each local town. These charts contain year-to-date (January 1 – September 30) statistics for each year. The graphs show the average sold price and the number of sales for each year back to 2004. Plus, this year’s Average Sold Price, The Number of Sales, The Percent of List Price to Sold Price, and the Average Days on the market.
You can find a PDF of the above chart here and a PDF containing all the charts below here.
*The statistics do not include any Smith Ranch Sales.
Condominium Sales
Breckenridge Condo Sales
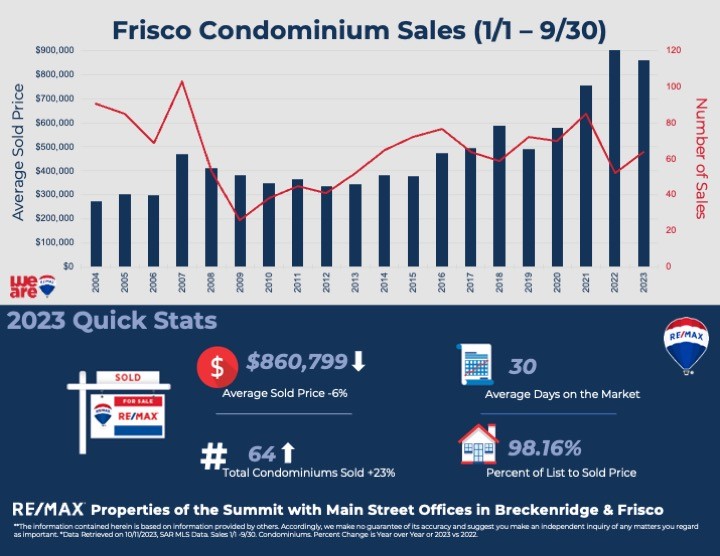
Frisco Condo Sales
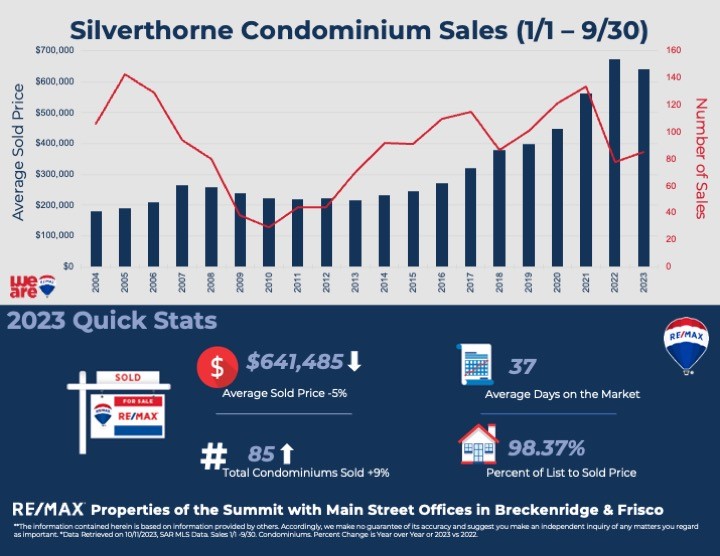
Silverthorne Condo Sales
Dillon Condo Sales
Keystone Condo Sales
Copper Mountain Condo Sales
Source: Sold Data from SAR MLS. Stats pulled on 10/11/23. *SAR MLS Data Year to Date Sales 1/1 – 9/30. *Residential Sales (home, Condo, Townhome & Duplex), Change is Year over Year 2023 vs 2022.
**The information contained herein is based on information provided by others. Accordingly, we make no guarantee of its accuracy and suggest you make an independent inquiry of any matters you regard as important.
Share This:
Blog Categories
Home Search Tools
Recent Posts
We use cookies to ensure that we give you the best experience on our website. If you continue to use this site we will assume that you are ok with this.