The April numbers are in, and they tell a more nuanced story than a quick glance might suggest. While some metrics are improving, others highlight shifts in buyer behavior and the growing influence of new construction—especially in the condominium market.
A Stronger April Helps Stabilize 2026 Trends
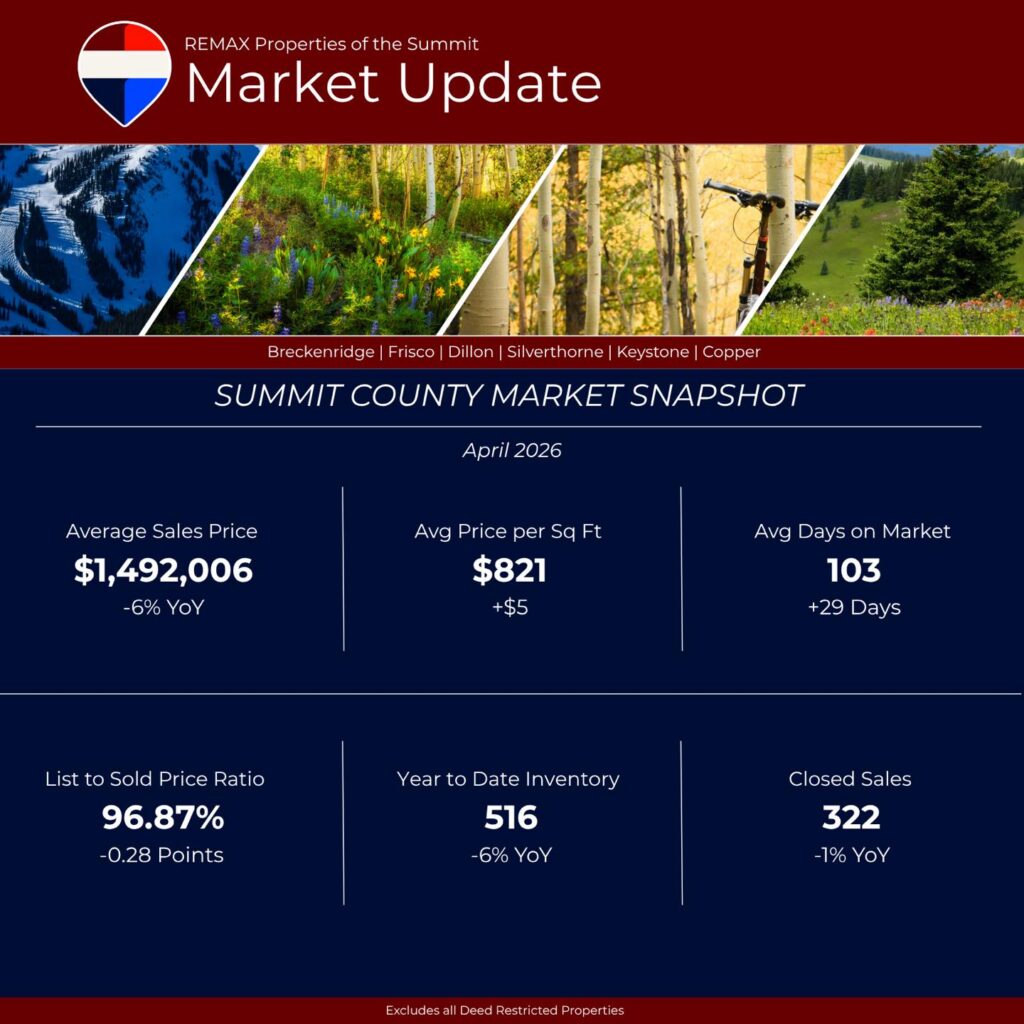
April residential sales in Summit County came in at double-digit gains compared to April of last year. That boost helped offset a slower start to the year, bringing year-to-date sales to just 1% below 2025 levels.
Pricing followed a similar pattern. The average sold price in April was higher than it was a year ago, which helped soften what had been a steeper decline earlier in 2026. As of now, the year-to-date average sales price is down about 6%—a noticeable improvement from earlier double-digit declines.
Single-Family vs. Condo Market Performance
When you break the data down by property type, two very different trends emerge:
- Single-family homes saw a slowdown, with sales down 15% and average prices down 4%
- Condominiums, on the other hand, experienced growth, with sales up 10% and average prices up 7%
At first glance, condos appear to be leading the market’s recovery—but there’s more to the story.
The Impact of New Construction
Newly built condominium sales are playing a significant role in shaping the current market data. These properties are helping to boost both overall sales volume and average pricing.
However, when you remove new construction condo sales from the equation, the numbers shift considerably:
- Condo sales would be down 15% instead of up 10%
- Average condo prices would be down 8% instead of up 7%
- Overall residential sales across Summit County would be down 13% year-to-date
This highlights just how much new development is influencing current trends.
What This Means for Buyers and Sellers
The takeaway? The Summit County market isn’t moving in just one direction—it’s being shaped by different forces depending on property type and inventory.
For buyers, this means opportunities may exist in certain segments, particularly in resale properties. For sellers, understanding where your home fits within these trends is key to pricing and positioning effectively.
As always, real estate is hyper-local, and these broader trends can look very different depending on the neighborhood, price point, and property type.
Statistics By Town
Click on the links below to see statistics for each of our towns within Summit County.
Source: Sold Data from SAR MLS. Stats pulled on 5/5/26. *AR MLS Data Year to Date Sales 1/1/26-4/30/26. *Residential Sales. Change is Year over Year 2026 vs 2025.
**The information contained herein is based on information provided by others. Accordingly, we make no guarantee of its accuracy and suggest you make an independent inquiry of any matters you regard as important.
Posted by Jan Leopold May 5, 2026