August 2023 Statistics: Summit County, CO Real Estate Update

Table of Contents

Resort Real Estate Stats: August 2023

Breckenridge Frisco Silverthorne Dillon Keystone Copper

Residential Sales

Residential Sales The chart above represents year-to-date sales through August going back to 2000. The chart shows the average residential sold price and the total number of sales for each year. Plus, the percentage changes from year to year.
 
Single Family Home Sales:  Below are detailed sales charts for Single Family Home sales for the county and each local town. These charts contain year-to-date (January 1 – August 31) statistics for each year. The graphs show the average sold price and the number of sales for each year back to 2004. Plus, this year’s Average Sold Price, The Number of Sales, The Percent of List Price to Sold Price, and the Average Days on the market.

*The statistics do not include any Smith Ranch Sales.

Single Family Home Sales

Breckenridge Homes
Frisco Homes
Silverthorne Homes
Dillon Homes
Keystone Homes
remax logo

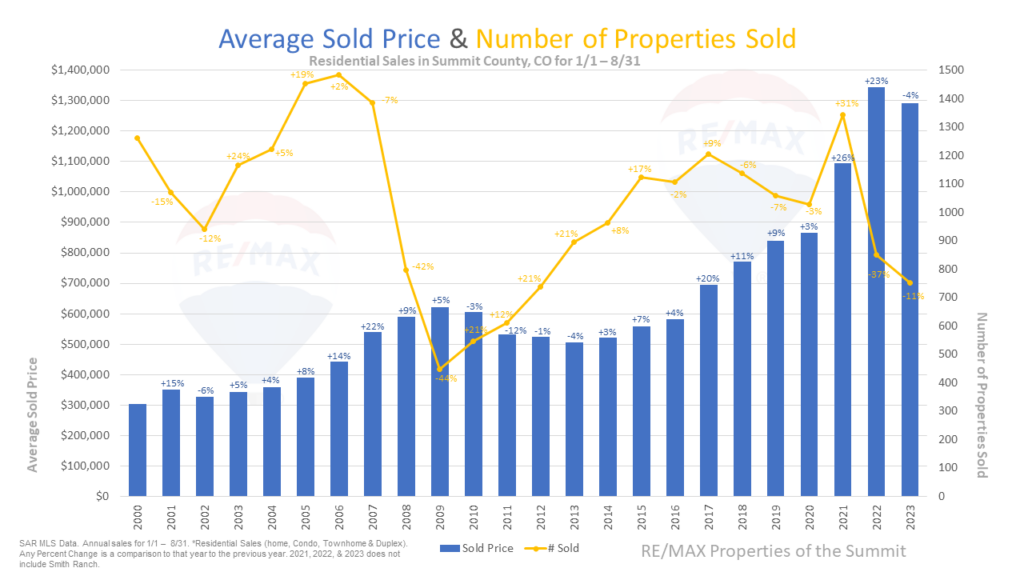
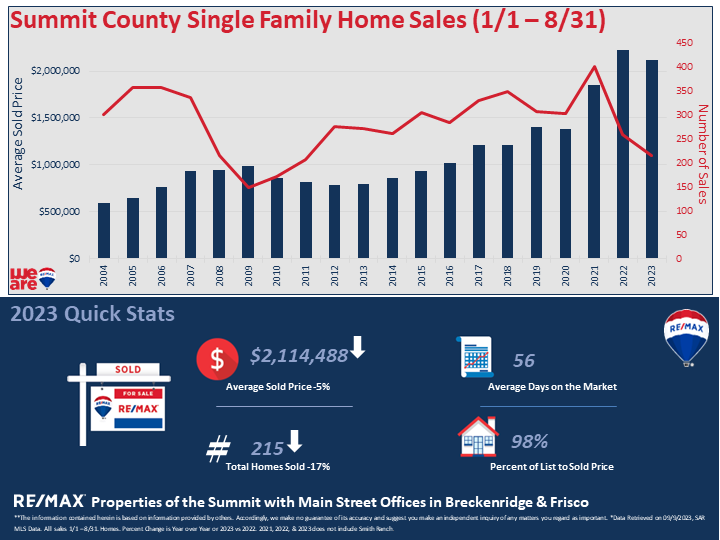
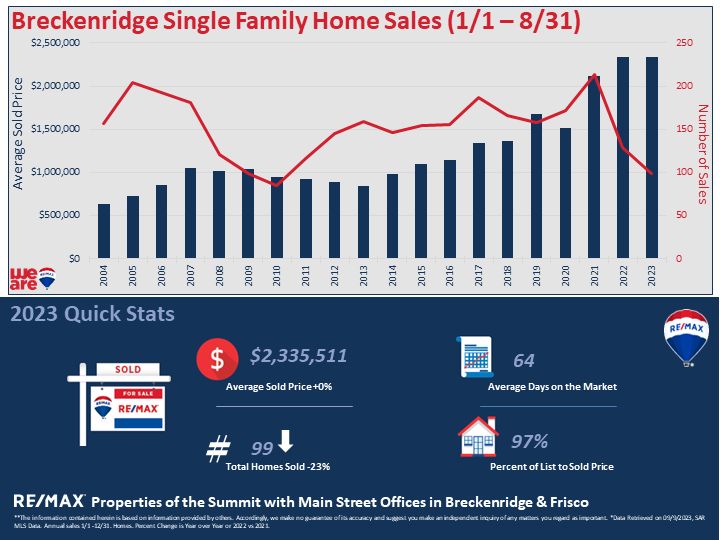
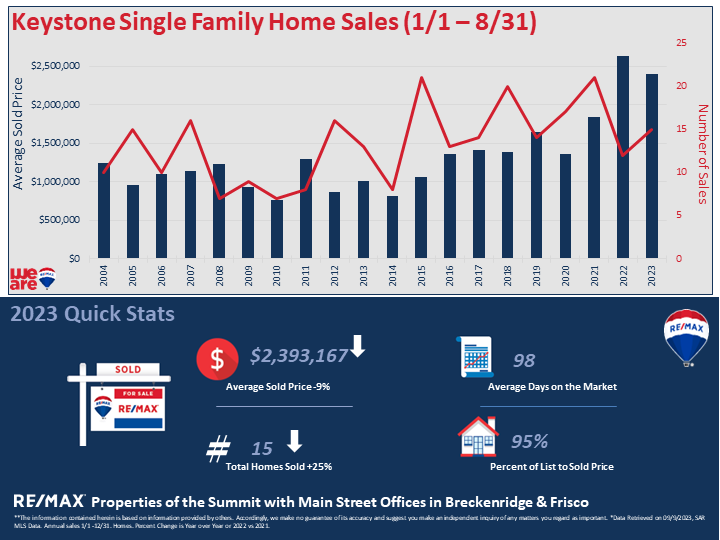
Source: Sold Data from SAR MLS.  Stats pulled on 9/9/23. *SAR MLS Data  Year to Date Sales 1/1 – 8/31. *Residential Sales (home, Condo, Townhome & Duplex),  Change is Year over Year 2023 vs 2022.

**The information contained herein is based on information provided by others. Accordingly, we make no guarantee of its accuracy and suggest you make an independent inquiry of any matters you regard as important. 

Share This: