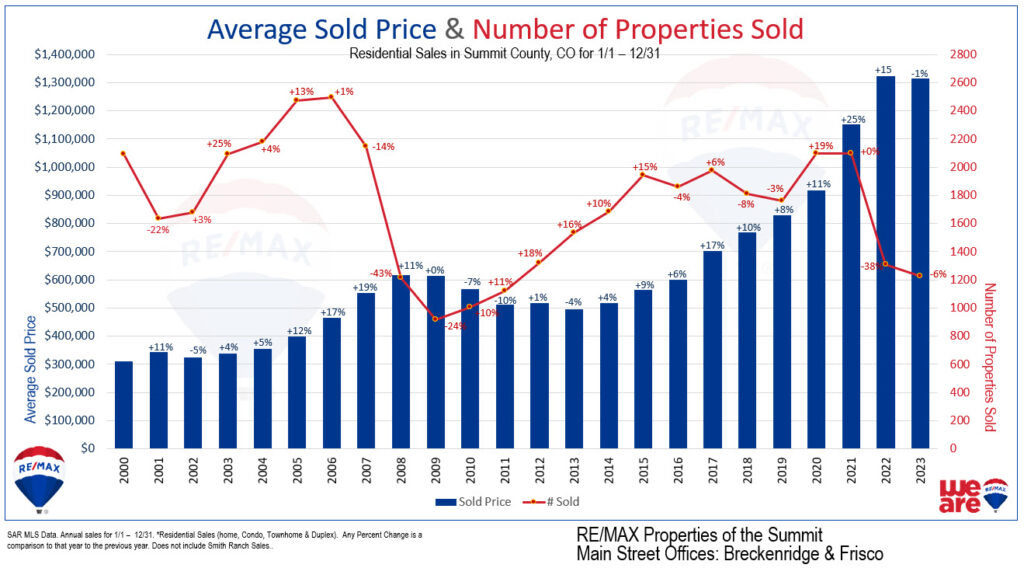


25-Year Chart Above: The last significant drop in sales (’07, ’08, and ’09) resulted in declining to flat prices and a noticeable up tick in sales, followed by six to eight years of steady growth. Currently, there are signs suggesting that a turnaround could occur next year, in 2025, and it may have already begun. We could well be on the road to another six-plus years of prosperity.
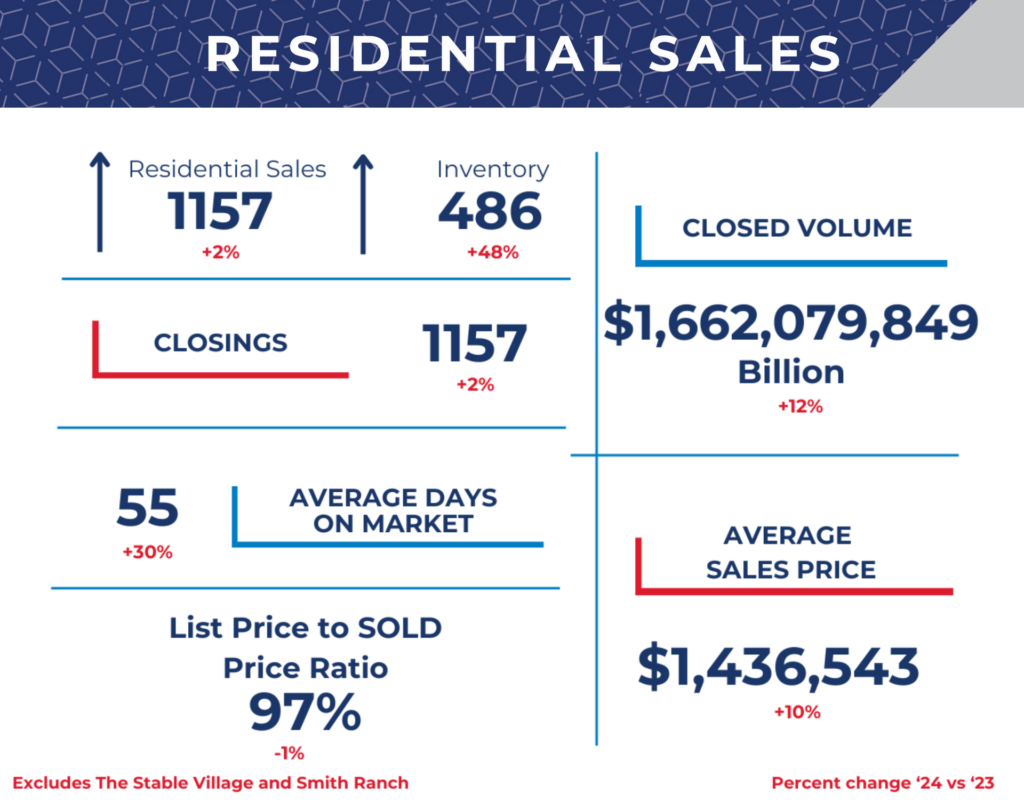
Nationally, October saw a turn around of pending activity, even before the election, the stock market is roaring into the end of the year, rates may come down more and, more important, consumers are realizing that rates probably will not drop to COVID levels. November sales in Summit County are up 22%, bringing the annual sales to a 2% increase and the driving factor to that was the lower sales prices in November – lower prices more sales (November sales prices dropped one percent year over year).
Statistics By Town
Click on the links below to see statistics for each of our towns within Summit County.
Source: Sold Data from SAR MLS. Stats pulled on 8/2/24. *SAR MLS Data Year to Date Sales 1/1/24-11/30/24. *Residential Sales. Change is Year over Year 2024 vs 2023.
**The information contained herein is based on information provided by others. Accordingly, we make no guarantee of its accuracy and suggest you make an independent inquiry of any matters you regard as important


