
January showings are up 60%, with the first half up 78% and the second half up 47%. This January, on average, it took 11 showings before a property went under contract; last year, it was 14. Interestingly, the second half of January had more showings than the first half in both 2024 and 2025.
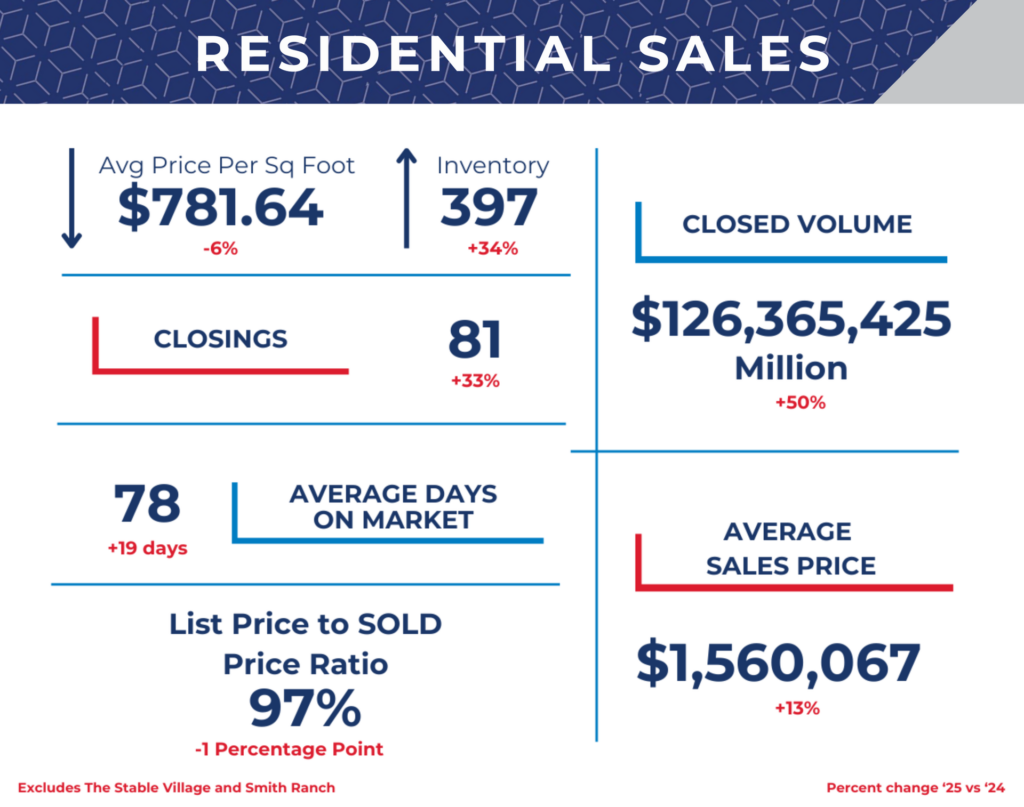
Market-wide, sales were up 33% in January 2025 compared to January 2024. This January, there were 104 new listings in Summit County and 85 new under contracts, with 81 closed. Interestingly, of the 104 New Listings, 23 went under contract in the same month they were listed.
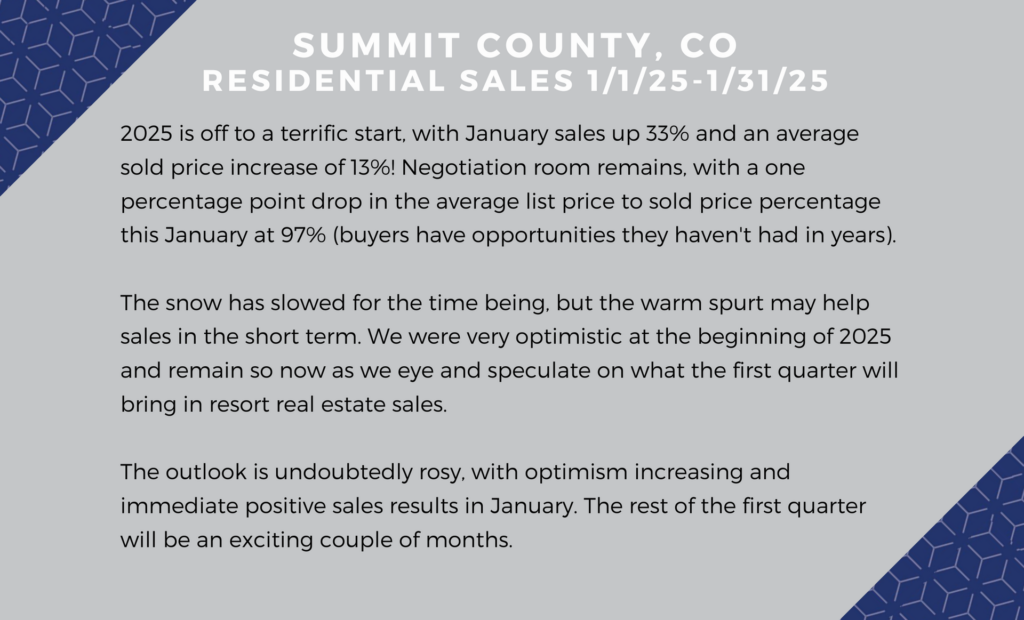
The January average sold price is on the rise by about 13%. Interestingly, there were three sales of over $6,000,000 this January, whereas there were none in January 2024. Of the 85 properties that went under contract in January, they have an average list price of almost $1.9 million. If they retain the average percentage of the list to the sold price of 97%, those 85 may have an average sold price of $1.85 million
Statistics By Town
Click on the links below to see statistics for each of our towns within Summit County.
Source: Sold Data from SAR MLS. Stats pulled on 2/4/24. *SAR MLS Data Year to Date Sales 1/1/25-1/31/25. *Residential Sales. Change is Year over Year 2025 vs 2024.
**The information contained herein is based on information provided by others. Accordingly, we make no guarantee of its accuracy and suggest you make an independent inquiry of any matters you regard as important.